首页 / Posts

[OriginPro] Basic Settings: Change the Default Font, Remove White Margins, and Enable Autosave

This article explains how to improve the appearance of OriginPro charts and simplify common operations with a few basic settings, including default fonts, page margins, and autosave configuration.

Rosetears·
··86 words·1 min

After installing OriginPro, the following settings can make your charts look better and save many repetitive steps:

  1. First, click Tools > Options, or press the shortcut Ctrl+U.
  2. Change the default font: click Text Fonts > Default(D), and change the font to Arial or Times New Roman.
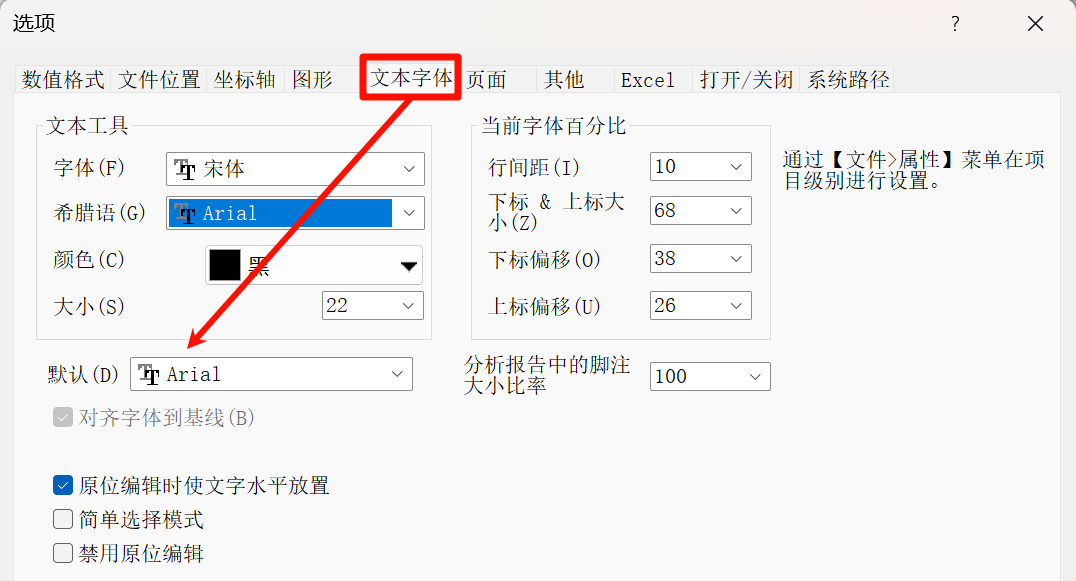
    image.png
  3. Remove white margins: click Page > Margin Control, and choose a compact layout inside the page.
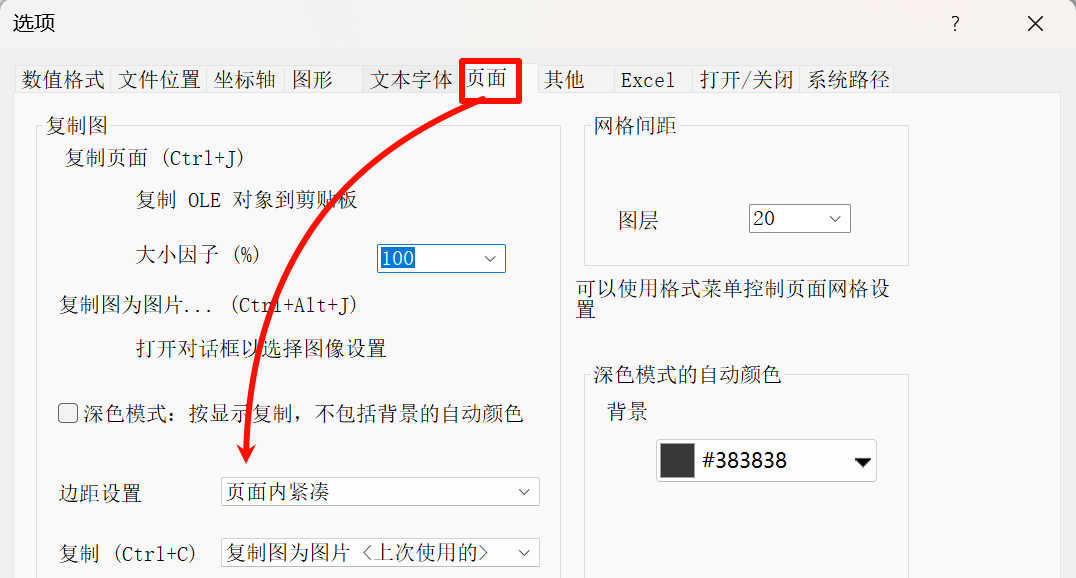
    image.png
  4. Set default saving: click Open/Close > Autosave project every, and change the save interval to a suitable value. I set it to 2 minutes.
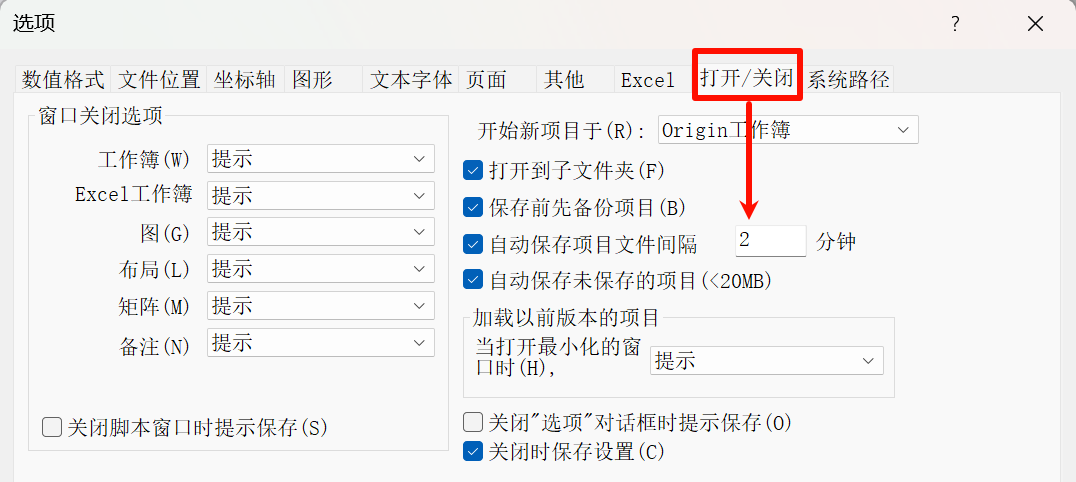

    image.png

Related

Regression Analysis — Differences Among Three Types of Logistic Regression

··453 words·3 mins
This article introduces three common logistic regression models: binary logistic regression, multinomial logistic regression, and ordered logistic regression. It explains their applications and differences for different dependent-variable types, helping readers understand when to use these statistical models in real analysis.

【SPSS】Regression Analysis — Linear Regression

··757 words·4 mins
This article introduces the main differences between linear regression and logistic regression, and explains the steps, result interpretation, and common statistics in regression analysis, such as R-squared, the Durbin-Watson value, and regression coefficients, helping readers understand how to use regression models for data analysis.

【SPSS】Correlation Analysis

··499 words·3 mins
This article introduces how to use SPSS for correlation analysis and how to interpret correlation matrices and heatmaps, helping readers quickly master correlation-analysis methods and result interpretation among scale dimensions.

【SPSS】Difference Analysis

··1475 words·7 mins
This article explains independent-samples t tests and one-way analysis of variance (ANOVA) in difference analysis, including SPSS operation steps, homogeneity-of-variance testing, t-value analysis, and result interpretation, helping readers understand how to compare mean differences between groups in data analysis.