Data Requirements:#
- Dependent variable: it should be an ordinal multi-category variable, meaning the categories have a clear order relationship, but the intervals between categories do not have to be equal. Examples include education level (primary school, junior high school, senior high school, university) or satisfaction ratings (very dissatisfied, dissatisfied, average, satisfied, very satisfied).
- Independent variables: independent variables can be continuous variables, such as age and income, or categorical variables, such as gender and region. For categorical variables, numeric codes are recommended to ensure the correctness of the order relationship.
Operation Steps:#
In the menu bar, choose “Analyze” > “Regression” > “Ordinal…” to open the ordered logistic regression analysis dialog box.
Set variables:
- Dependent variable (Dependent): drag the ordered multi-category dependent variable into this box.
- Factors: drag categorical independent variables into this box.
- Covariates: drag continuous independent variables into this box.
Click the “Statistics” button and select “Test of parallel lines” to test the model’s parallel-lines assumption.
Click “Continue,” then click “OK” to run the analysis.
Result Interpretation:#
Test of parallel lines: Check the result in the parallel-lines assumption test section. If the p-value is greater than 0.05, the parallel-lines assumption holds and you can continue with subsequent analysis. If the p-value is less than 0.05, the parallel-lines assumption does not hold, and other types of logistic regression, such as multinomial logistic regression or binary logistic regression, are recommended.
Model fitting information: Check model goodness-of-fit indicators, such as the -2 log likelihood value and the p-value of the likelihood-ratio test. If the p-value is less than 0.05, the model fits well and the fitted result is statistically significant.
Parameter estimates: Check each independent variable’s regression coefficient, standard error, Wald statistic, and p-value. Independent variables with p-values below 0.05 are statistically significant and can be considered to have a strong effect on the dependent variable.
Pseudo R-squared: Pseudo R-squared is used to evaluate model fit and measures the match between model predictions and actual observed data. Three common pseudo R-squared methods are:
- McFadden’s pseudo R-squared: designed for discrete-choice models and widely used in economics and social-science research. This item is recommended as the first one to analyze.
- Nagelkerke pseudo R-squared: an adjustment of McFadden’s pseudo R-squared that provides a more intuitive evaluation of goodness of fit.
- Cox-Snell pseudo R-squared: another commonly used pseudo R-squared method.
In general, a higher pseudo R-squared value indicates better model fit.
Regression Equation#
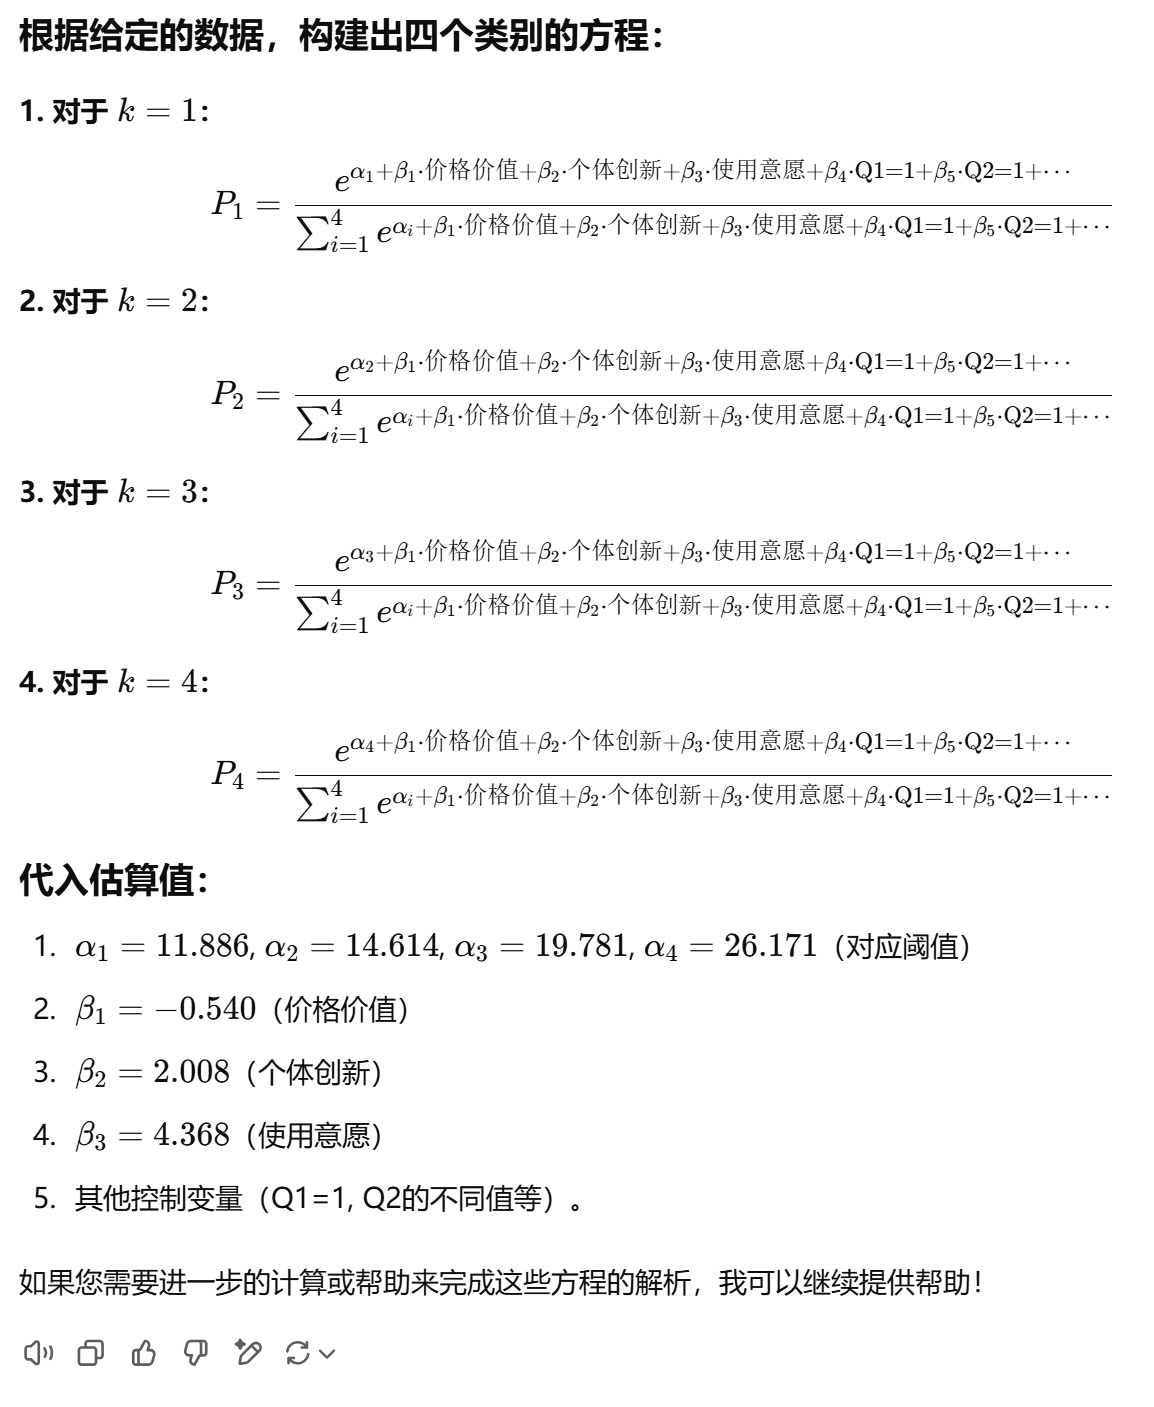
The regression equation for ordered logistic regression is as follows:
$$ P_k = \frac{e^{(\alpha_k + \beta_1 X_1 + \beta_2 X_2 + \cdots + \beta_k X_k)}}{\sum_{i=1}^K e^{(\alpha_i + \beta_1 X_1 + \beta_2 X_2 + \cdots + \beta_k X_k)}} $$
$$ \begin{array} This equation calculates the probability of each category, where P_k is the probability that the dependent variable belongs to category k, \ \alpha_k is the constant term, \ \beta_1, \beta_2, \dots, \beta_k are the regression coefficients of the independent variables,\ X_1, X_2, \dots, X_k are the independent variables. \end{array} $$
Result Explanation:#
- Model fitting information: By checking the model’s significance value (p-value), if the significance value is less than 0.05, the model fit is significant and can effectively explain the relationship between the dependent variable and independent variables.
- Pseudo R-squared: Pseudo R-squared is used to measure model fit. A higher value indicates a better fit. It is recommended to first analyze McFadden’s pseudo R-squared, followed by Nagelkerke and Cox-Snell pseudo R-squared.
- Test of parallel lines: If the p-value of the test of parallel lines is greater than 0.05, the parallel-lines assumption holds and ordered logistic regression analysis can continue. If the p-value is less than 0.05, the parallel-lines assumption does not hold, and other regression analyses, such as multinomial or binary logistic regression, should be considered.
Interpreting these analysis results can help you better understand the application of the ordered logistic regression model, identify which independent variables have significant effects on the dependent variable, and evaluate model fit. If you have more questions or need further explanation, feel free to ask!