Steps#
Calculate variables:
- Transform > Compute Variable
- Enter the dimension name as the target variable, and enter
mean(first item under the dimension to last item under the dimension)as the numeric expression.- For example, you do not need to type the item names manually; just click the corresponding labels on the left:
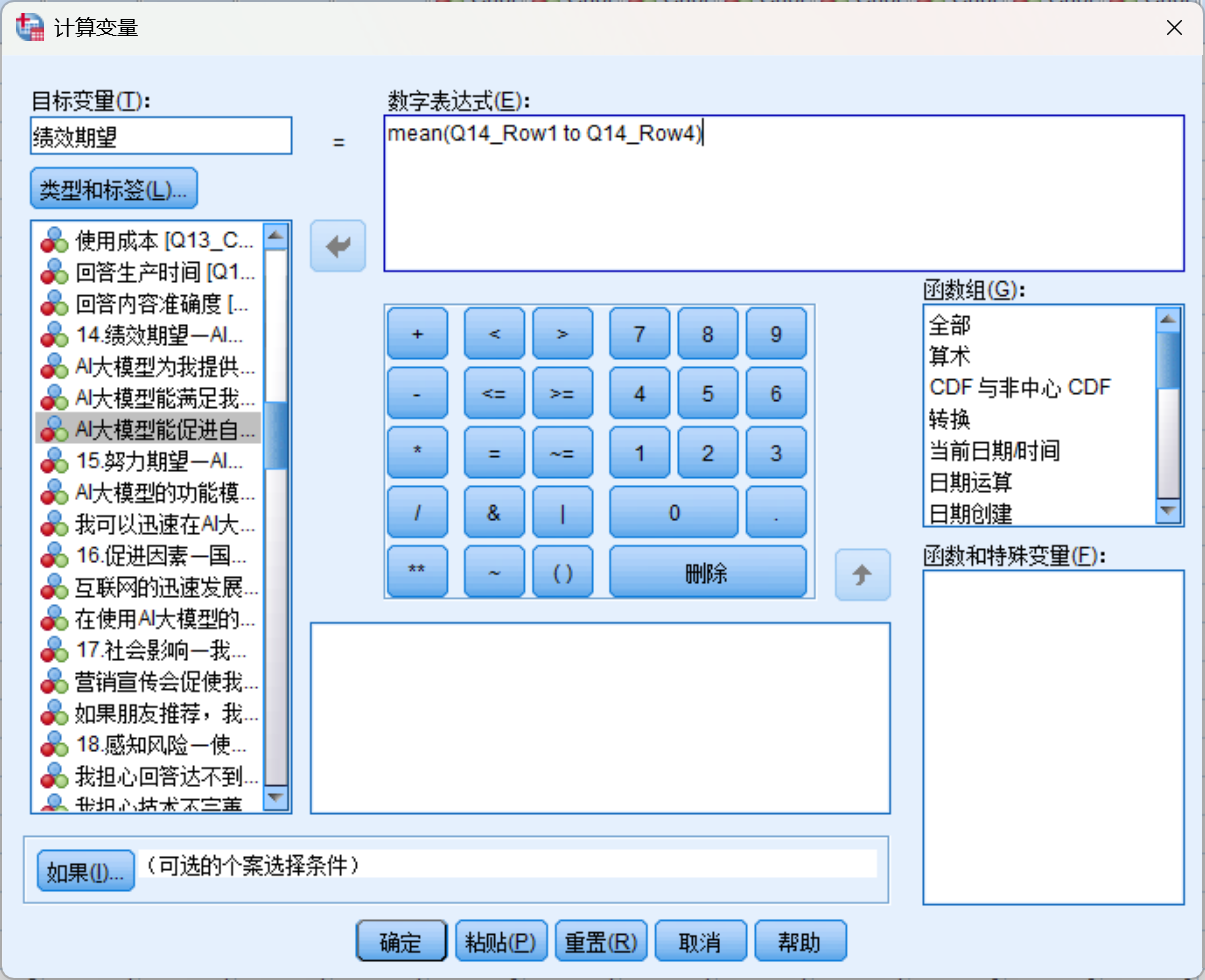
- For example, you do not need to type the item names manually; just click the corresponding labels on the left:
- Perform the same operation for all dimensions.
Choose the analysis method: click “Analyze” > “Correlate” > “Bivariate” in the menu bar.
Select variables: in the dialog box, add the variables whose correlations you want to analyze, usually all scale dimensions, to the “Variables” box.
Choose correlation coefficient type: in the “Correlation Coefficients” section, usually select Pearson’s correlation coefficient. If the data do not meet the normal-distribution assumption, choose Spearman or Kendall.
Run the analysis: after setting everything, click “OK” to run the analysis.
View results: SPSS generates a correlation coefficient matrix in the output window, including the correlation coefficient and significance level (p-value) for each pair of variables. Usually, p < 0.05 indicates a significant correlation.
Table: draw the table in the following style:
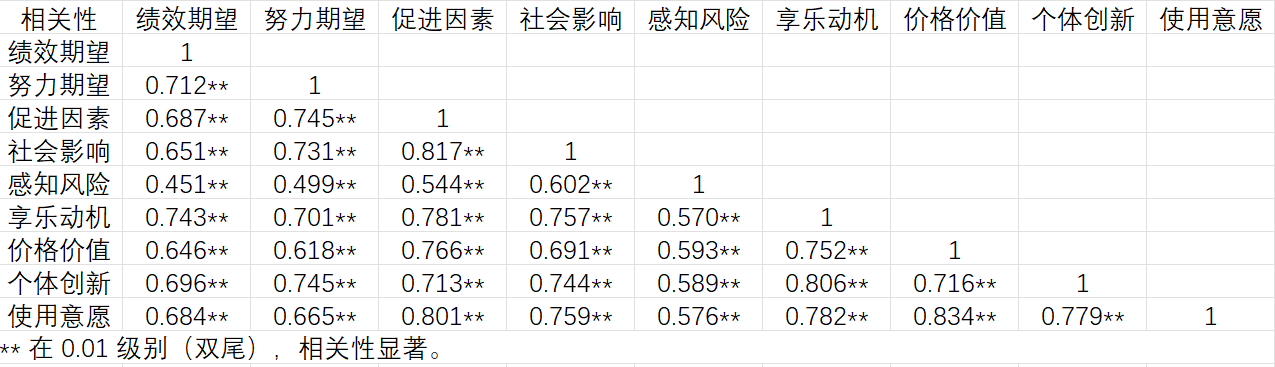
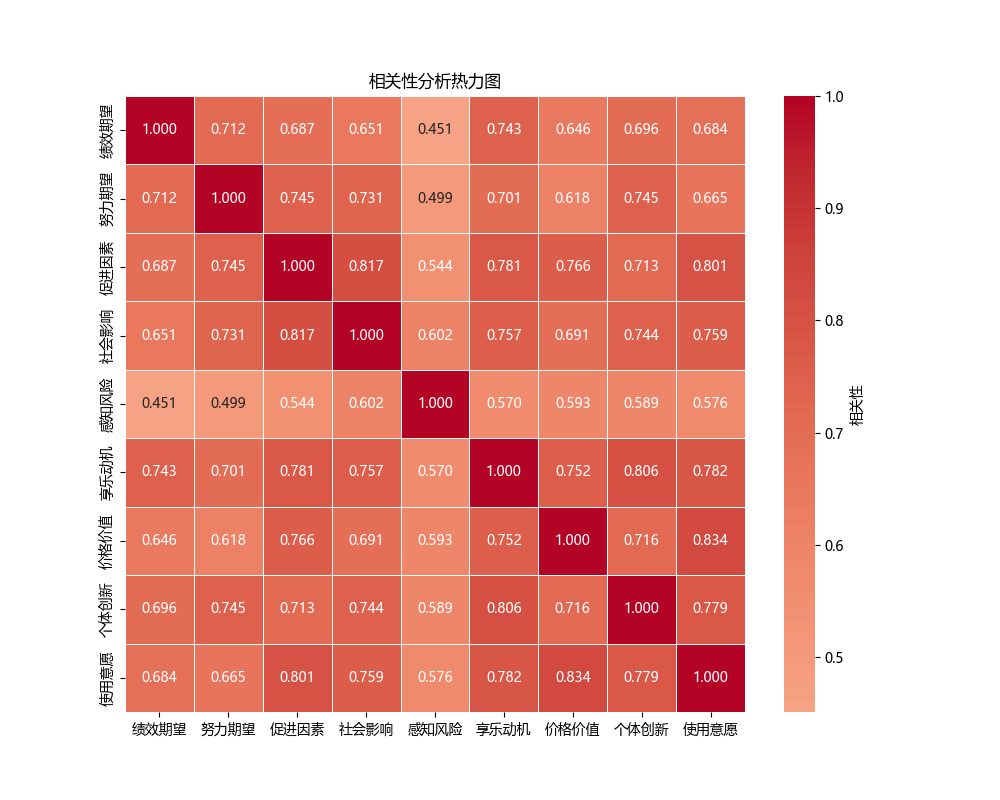
Heatmap: you can also draw a heatmap to make the result more intuitive and visually pleasing:
Interpretation#
*: p < 0.05 **: p < 0.01 ***: p < 0.001
Word Explanation#
| Correlation | Performance expectancy | Effort expectancy | Facilitating conditions | Social influence | Perceived risk | Hedonic motivation | Price value | Personal innovativeness | Behavioral intention |
|---|---|---|---|---|---|---|---|---|---|
| Performance expectancy | 1 | ||||||||
| Effort expectancy | 0.712** | 1 | |||||||
| Facilitating conditions | 0.687** | 0.745** | 1 | ||||||
| Social influence | 0.651** | 0.731** | 0.817** | 1 | |||||
| Perceived risk | 0.451** | 0.499** | 0.544** | 0.602** | 1 | ||||
| Hedonic motivation | 0.743** | 0.701** | 0.781** | 0.757** | 0.570** | 1 | |||
| Price value | 0.646** | 0.618** | 0.766** | 0.691** | 0.593** | 0.752** | 1 | ||
| Personal innovativeness | 0.696** | 0.745** | 0.713** | 0.744** | 0.589** | 0.806** | 0.716** | 1 | |
| Behavioral intention | 0.684** | 0.665** | 0.801** | 0.759** | 0.576** | 0.782** | 0.834** | 0.779** | 1 |
The correlation coefficient between performance expectancy and effort expectancy is 0.712, P < 0.01, indicating a moderate positive correlation.
The correlation coefficient between effort expectancy and facilitating conditions is 0.745, P < 0.01, indicating a moderate positive correlation.
The correlation coefficient between facilitating conditions and social influence is 0.817, P < 0.01, indicating a high positive correlation.
The correlation coefficient between social influence and perceived risk is 0.602, P < 0.01, indicating a moderate positive correlation.
The correlation coefficient between hedonic motivation and price value is 0.752, P < 0.01, indicating a moderate positive correlation.
The correlation coefficient between personal innovativeness and behavioral intention is 0.779, P < 0.01, indicating a moderate positive correlation.
The correlation coefficient between behavioral intention and price value is 0.834, P < 0.01, indicating a high positive correlation.